
OPEN DATA DAY
- Details
- Last Updated on Wednesday, 16 March 2016 18:02

Sabato 5 Marzo 2016
ORE 9:30
Sala Eventi Tecnopolo
Via Vivarelli, 2 - Modena
L'EVENTO E' GRATUITO E APERTO A TUTTI
Gli Open Data sono dati pubblicati online che possono essere liberamente acceduti, rielaborati e ridistribuiti da chiunque senza costi di licenza. La Pubblica Amministrazione è uno dei distributori principali di Open Data, rendendo accessibili dati demografici, geografici, dati sull'occupazione, sui trasporti, sui servizi e molti altri.
Poter aver a disposizione un bacino di dati aperti, accessibili e utilizzabili in modo condiviso ci permette di “mescolarli” tra loro o con dati di nostra proprietà al fine di estrarre nuovi indicatori. L'integrazione di Open Data può quindi dare impulso allo sviluppo di nuovi e migliori prodotti e servizi.
L'evento è organizzato in occasione della giornata internazionale dedicata agli Open Data: in un unico giorno, in tutti i Paesi del mondo si esplora il fenomeno degli Open Data e si discutono le modalità per estrarre valore dai dati pubblici, fornendo a cittadini, amministrazioni pubbliche e imprese una valutazione concreta delle diverse opportunità che gli Open Data offrono.
L’evento Open Data Day modenese, organizzato dall’Ing. Laura Po per il DBGroup, con il patrocinio del Dipartimento di Ingegneria “Enzo Ferrari” di Modena, si terrà Sabato dalle ore 9.30 presso la Sala Eventi del Tecnopolo e riunirà allo stesso tavolo ricercatori e professori del Dipartimento, realtà imprenditoriali del territorio, i responsabili degli uffici Servizio Progetti Telematici, Comunicazione Città Intelligente, Assessorato alle Politiche Giovanili, Assessorato Sistemi informatici e Smart city del Comune di Modena e i responsabili del Assessorato alle Politiche Giovanili e del Piano Telematico della Regione Emilia Romagna, professori esperti in Open Data dell’Università di Firenze e dell’Università di Bologna.
![]()
PROGRAMMA DELLA GIORNATA:
* 9:30-9:50 SALUTI ISTITUZIONALI
* 9:50-10:10 COSA SONO GLI OPEN DATA E COSA CI SI PUÒ FARE
Ing. Laura Po, Prof. Sonia Bergamaschi - DBGROUP – DIPARTIMENTO DI INGEGNERIA “ENZO FERRARI”
* 10:10-10:30 SMART CITY E OPEN DATA NEL COMUNE DI MODENA
Assessora Ludovica Carla Ferrari ASSESSORE SMART CITY DEL COMUNE DI MODENA
Dott. Luca Chiantore - DIRIGENTE SERVIZIO PROGETTI TELEMATICI, COMUNICAZIONE E CITTÀ INTELLIGENTE - COMUNE DI MODENA
* 10:30-10:50 LA REGIONE ER E I PROGETTI CON GLI OPEN DATA
Dott. Massimo Fustini – PROGETTO OPEN DATA EMILIA ROMAGNA - REGIONE EMILIA ROMAGNA
* 10:50-11:00 PAUSA CAFFÈ
* 11:00-11:30 PROGETTO OPEN LINKED DATA PER LE POLITICHE GIOVANILI
Ing. Laura Po, Prof. Sonia Bergamaschi - DBGROUP – DIPARTIMENTO DI INGEGNERIA “ENZO FERRARI”
Dott. Paola Francia - ASSESSORATO POLITICHE GIOVANILI COMUNE DI MODENA
Dott. Marina Mingozzi, Dott. Antonio Volpone - ASSESSORATO POLITICHE GIOVANILI REGIONE EMILIA ROMAGNA
* 11:30-11:50 CREARE VALORE DAGLI OPEN DATA
Ing. Mirko Orsini - DATARIVER S.R.L.
* 11:50-12:10 L’UNIVERSITÀ COME AGGREGATORE DI OPEN DATA DEL TERRITORIO: L’ESPERIENZA FIORENTINA
Prof. Paolo Nesi – DISIT LAB –UNIVERSITÀ DI FIRENZE
* 12:10-12:30 LA QUALITÀ DEI DATI APERTI
Prof. Monica Palmirani - DIPARTIMENTO DI SCIENZE GIURIDICHE – UNIVERSITÀ DI BOLOGNA
PRESENTAZIONI DEGLI INTERVENUTI:
Laura Po - Cosa sono gli open data e cosa ci si può fare
Luca Chiantore - Strategie Open Data nel Comune di Modena
Massimo Fustini - Progetto Open Data Regione Emilia Romagna
Laura Po, Antonio Volpone, Paola Francia - Progetto Open Data per le Politiche Giovanili
Mirko Orsini - Creare valore dagli Open Data
Paolo Nesi - L'università come aggregatore di Open Data: l'esperienza fiorentina
Monica Palmirani - La qualità dei dati aperti
RESOCONTO DELL'EVENTO:
articolo pubblicato su FORUM PA
ALTRE CITAZIONI DELL'EVENTO:
LaRepubblica-Sezione Tecnologia
Giulia Annovi (data journalist)
Open Data and Linked Open Data
- Details
- Last Updated on Wednesday, 21 October 2015 12:45
 OPEN DATA PROJECTS
The dbgroup is active in the re-use, integration, navigation, querying and publication of open data.
By using a suite of tools, we are able to
- Manage your data (integration, curation)
- Use and mix them with others' data (discovering, linking)
- Make sense of data (query, analytics, visualization)
- Publish your data in the Linked Open Data Cloud (publication, navigation, query)
Open data projects aims to enhance the private information by relating them with open data.
In 2015, we concluded a one-year project focused on the topics of population, education and work, funded by the municipality of Modena, Duringt the project, we were able to (1) identify interesting data sources both from the open data community and from the private repositories of local governments of Emilia Romagna region related to the Youth Policies; (2) to integrate them and, to show up the result of the integration by means of a useful navigator tool (3); in the end, (4) to publish new information as Linked Open Data. For more information click here.
 LINKED OPEN DATA TOOL
We have developed a tool for navigation, querying and visualization of Linked Open Data sources.
By using LODeX, a user can visualize, browse and query a LOD source starting from the URL of its SPARQL endpoint.
LODeX provides:
- a schema summary of a LOD source, with the capabilities of showing a view of the schema/instances of a LOD source
- a visual query panel, so that the user can easily build and refine his/her query.
The LODeX tool can be used following this link (release compatible with Chrome and Opera)
If you want to use another browser, please go to the previus version at this link.
More information on the Linked Open Data and LODeX are available here
Activities on Open Data and Linked Open Data
- October 2015
- Laura Po attended the Smart City Exhibition 2015 @Bologna, Italy (8-10 October).
- Fabio Benedetti presented the paper titled "LODeX: A tool for Visual Querying Linked Open Data" at 14th International Semantic Web Conference (October 11-15, 2015) @Bethlehem, Pennsylvania, USA
- Fabio Benedetti presented the paper titled "LODeX: A tool for Visual Querying Linked Open Data" at 14th International Semantic Web Conference (October 11-15, 2015) @Bethlehem, Pennsylvania, USA
- July 2015
- Francesco Guerra e Sonia Bergamaschi are track organizers of the Second International Workshop " Big Data Principles, Architecture & Applicationds (BDAA) 2015" as part of the International Conference on High Performance Computing & Simulation (HPCS 2015) :http://hpcs2015.cisedu.info/2-conference/hpsc-2015-symposia/bdaa
- G. Simonini, S. Zhu: "Big data exploration with faceted browsing". In IEEE Proceedings of the International Conference on High Performance Computing & Simulation (HPCS 2015), Special Session on Big Data Principles, Architectures & Applications, Amsterdam, 20-24 July 2015.
TestTesiTabMore
- Details
- Last Updated on Tuesday, 14 July 2015 15:00
AUTORE DELLA TESI
AZIENDA OSPITANTE
DETTAGLIO TESI
Progetto Open linked data dell'Osservatorio Giovani della Regione Emilia-Romagna
- Details
- Last Updated on Wednesday, 07 October 2015 15:26
This was a one-year project, funded by the city of Modena, in the research area of the Open Data and Open Government. The project goals were: to identify interesting
data sources both from the open data community and from the private repositories of local governments of Emilia Romagna region related to the Youth Policies,
in particular, to the topics of population, education and work; to integrate them and, to show up the result of the integration by means of a useful navigator
tool; in the end, to publish new information as Linked Open Data.
The key partners in this project were the municipality of Modena, the Emilia Romagna region and the Dbgroup, under the scientific direction of Prof. Bergamaschi.
- The first phase was devoted to a deep and wide analysis of the available data sources (local, regional, national and international) in order to individuate the most relevant ones.
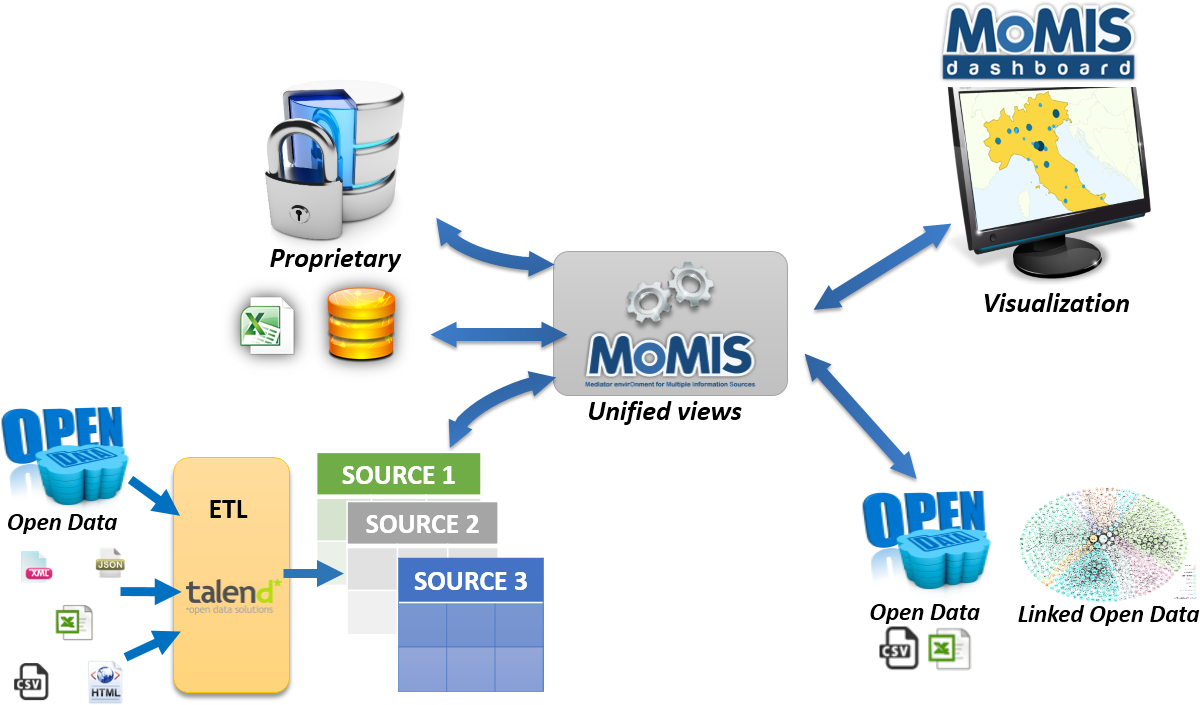
- The second phase made use of the open source data integration system, MOMIS, to integrate the selected data sources in virtual global views.
- The third phase provided an easy-to-use dashboard, i.e. MOMIS dashboard, to visualize the information emerging from aggregated data.
- Finally, the fourth phase aimed to make the resulting valueadded information, public and searchable on the Web as Linked Open Data.
First phase: sources selection
In the first phase of the project, we focus on the selection of the most relevant data sources w.r.t the main dimensions of analysis of the project, i.e. municipalities and provinces of the Emilia Romagna Region. We have used and analyzed both proprietary and open data sources, the proprietary data sources was provided by the Emilia Romagna region, the sources were:
- A database of current spending projects: it contains information about the fundings provided for projects on youth populations actuated in the different provinces of the region;
- An excel file of capital spending projects: it contains information about funding provided for long period investments (e.g. build structures, equipments);
- A database of social centers (SAG - "Spazi diAggregazione Giovanile"): it lists all the places where young people get together or places where recreational activities for youth are organized;
- Three Excel files related to the youth information project ("Progetto Informagiovani"): The information centers provide data at local, national and international level on different topics of interest for young people aged 13 to 35 years. The main areas covered are relate to study, work, continuing education, travel and holidays, study and work abroad, leisure, social life and health. These files contain statistics about the number of visitors of the website, the number of points on the region and the number of editors;
- An Excel file about the Young ER Card project: YoungERcard is the new card designed by the Emilia Romagna region for young people aged between 14 and 29 residents, students or workers in Emilia Romagna. The card is distributed for free and reserve holders a series of facilities for the enjoyment of cultural and sportive events and discounts at various shops. The file reports information related to the Young Emilia Romagna Card distribution and extensiveness in the region.
Regarding open data sources, several sites and portals that publish information regarding the youth population have been investigated. Not all sources have revealed to be of interest/usable for the project and thus have not been included in the data sources to be integrated. At the end we have seletected this sources:
- Emilia Romagna Statistical Service: this website is divided into several thematic sites that report information on population, transport, sports, productive sectors, etc.. For our project, we focused on the "population" and "education" sites.
- National Student Register - MIUR: this register, provided by the Italian Ministry of Education, University And Research, contains information on the number of students and graduates in the various degree courses of Italian universities.
Some naming conflicts occur on the province names. The main problems were found on the provinces of Reggio Nell'Emilia and Forlì-Cesena that were written in different ways, for example "Reggio Emilia", "Reggio-Emilia",
"Forlì e Cesena", "Forli-Cesena".
For solving this problem, we choose as golden standard the names used on the Regional Statistical Service, namely "Forlì-Cesena'' and "Reggio Nell'Emilia'', and we converted any other forms to the gold standard.
Second phase: data integration
At the end of the first phase of data extraction and transformation, we had the following data sources:
- Current spending projects: information about funding provided for projects on youth populations actuated in the different provinces of the region;
- Capital spending projects: information about funding provided for long period investments (e.g. build structures) organized for each province and year;
- Number of youth residents: number of youth residents in each province of the region Emilia Romagna and for each year;
- Number of Youth Information Centers: numbers of points of the Youth Information Centers located in each province and year.
- Number of editors in the Youth Information Centers: number of member in the editorial staff operating in the Youth Information Centers for each province and year.
- Number of web site visitors Informagiovanionline: information about the number of the visitors to the website Informagiovanionline for each province and year.
- Young ER Card: data on the Young ER Card for each province and year.
- Number of graduates supply by MIUR: information about the number of graduated for each province and year.
- Number of matriculations at the university supply by MIUR: information about the number of matriculations for each province and year.
All these sources have two dimensions in common: the year and the province. We conducted two analysis for evaluating the data coverage over the two dimensions. We found no lack of data over the provinces, meaning that the data are spread in all the provinces. Instead, focusing on the entire interval of years (2006-2014), we found a relevant number of missing data, that is reported in the table below.
| Source | Year | ||||||||
| 2006 | 2007 | 2008 | 2009 | 2010 | 2011 | 2012 | 2013 | 2014 | |
| 1 | |||||||||
| 2 | |||||||||
| 3 | |||||||||
| 4 | |||||||||
| 5 | |||||||||
| 6 | |||||||||
| 7 | |||||||||
| 8 | |||||||||
| 9 | |||||||||
To integrate our sources we used MOMIS a system able to aggregate data coming from heterogeneous data sources, you can find all the informations
about MOMIS on DataRiVer.
Since MOMIS allows the creation of more virtual integrations, called Global Schemas, to avoid a proliferation of null values in the integration result, we created three different Global Schemas:
- GS-Global: this GS contains the data from all the nine sources, on this GS we created a view that it is used in the MOMIS Dashboard (see next chapter for details) and includes only data of 2014;
- GS-Projects-Informagiovani: this GS excludes the Young ER Card from the integration; On this integration, we were interested to show the correlations between the data of the Informagiovani project and the data of education and founded projects; thus we created a view on the period 2009 - 2013, where most of these sources have available data.
- GS-Projects: this GS considers only sources 1, 2, 3, 8 and 9, in order to create charts on the entire period that show the correlation between founded projects, population and education.
Third phase: data visualization
To visualize the integrated data we used the MOMIS Dashboard, an interactive visualization tool developed by DataRiVer that offers several views on a set of data. It makes easier to
compare data and capture useful information. It allows to filter the data and visualize the results through different charts. In particular, it is possible to display line charts (for showing trends),
barcharts, pie charts, bubble charts on a Google Maps, or show the data in a tabular view.
Here are some of the charts that we have created to answer the politicians questions. Click on images to enlarge them.
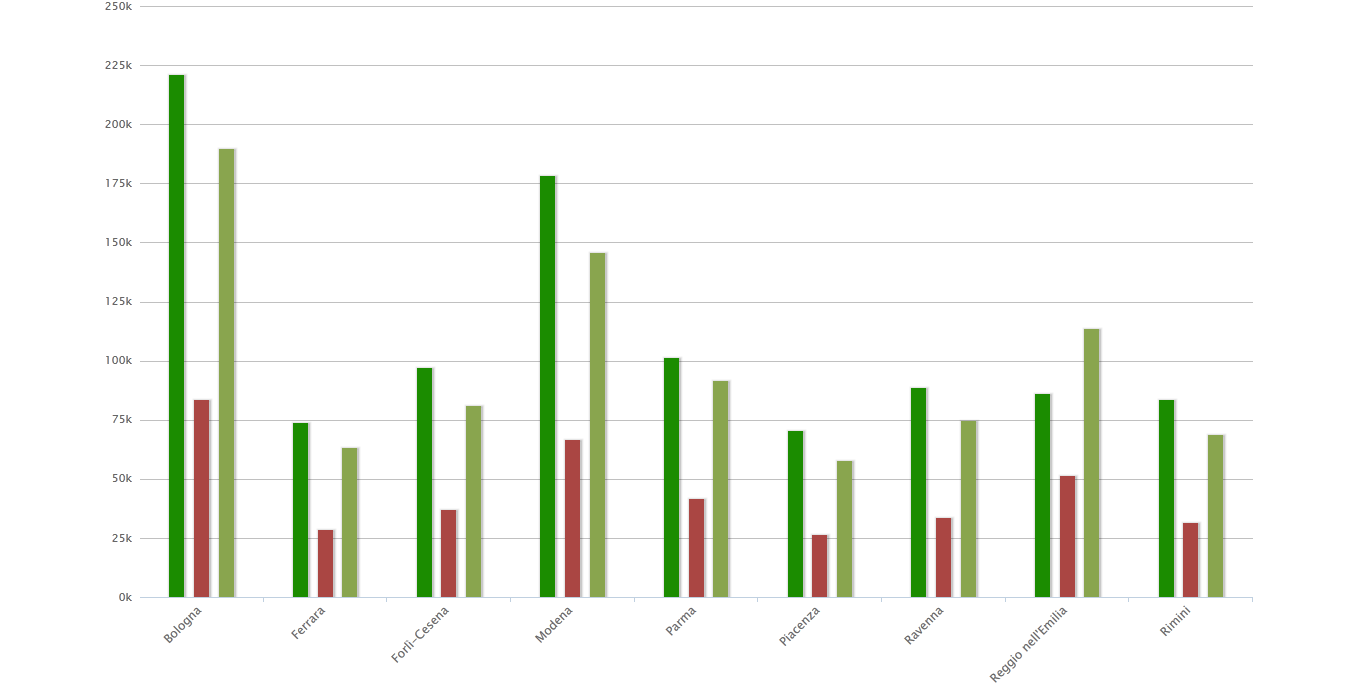
A bar chart comparing fundings and youth population (in light green). |
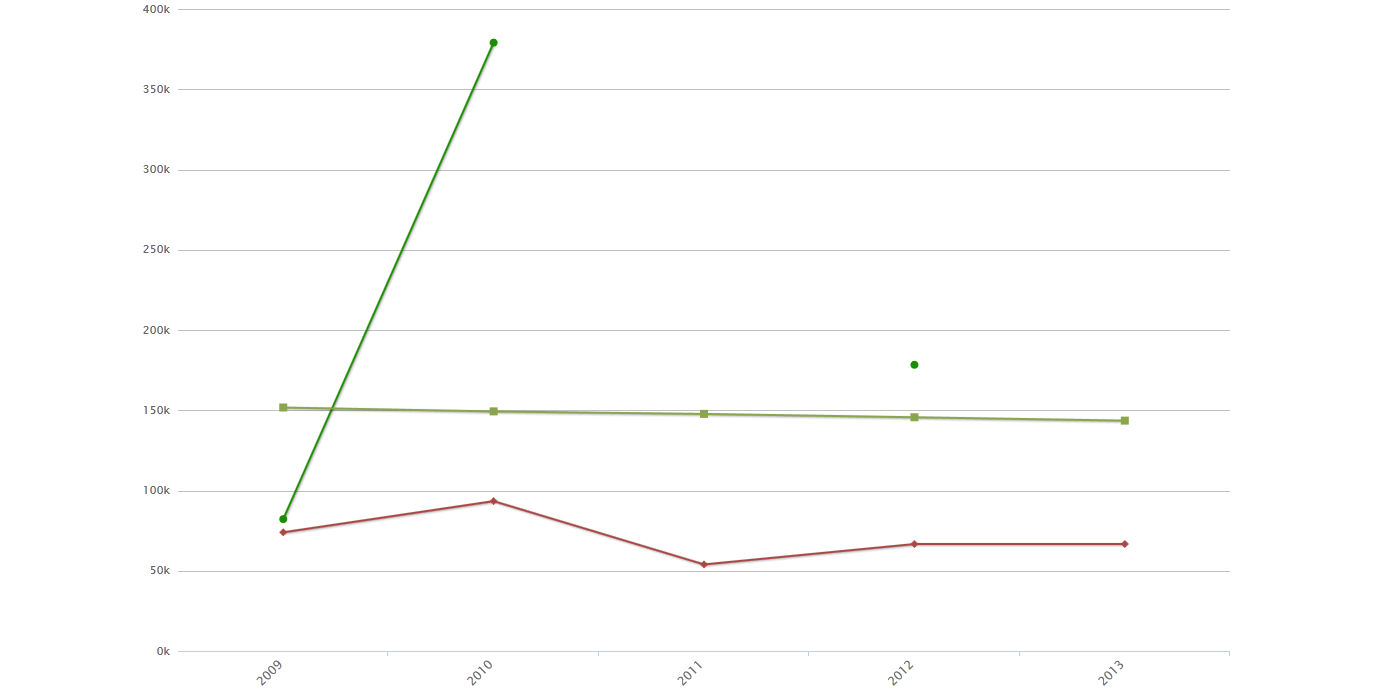
Fundings and youth population (in light green) trends in the province of Modena from 2009 to 2013. |

A map comparing fundings and youth population (in light green). |
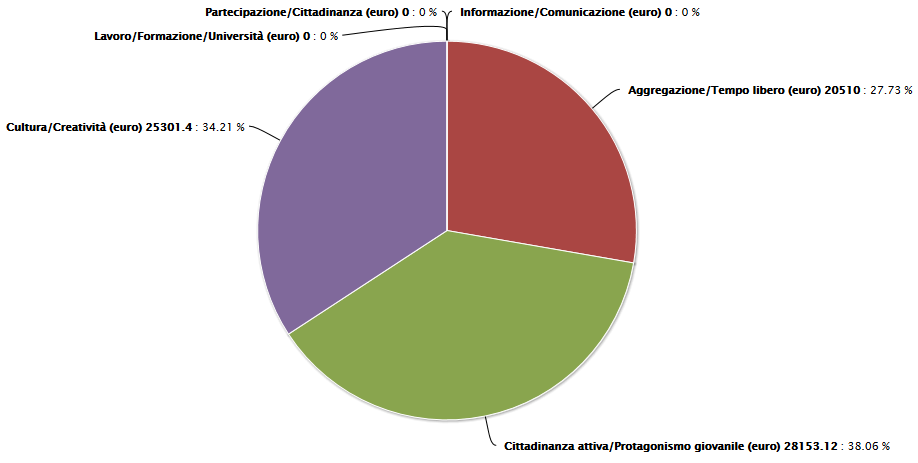
Funded projects/areas in the province of Modena on 2009 |
Fourth phase: publishing Linked Open Data
In order to publish in the LOD cloud the project results, we needed a tool for mapping a relational source in RDF.
The tools for automatic mapping generation define a set of mappings between RDB and RDF namely: an RDB record is a RDF node, the column name of an RDB table is a
RDF predicate and an RDB table cell is a value. Among these tools, we selected D2RQ as it allows users to define customized mappings.
Using D2RQ we have connected our data with DBpedia and GeoNames.
You can explore the result of data conversion by clicking here.
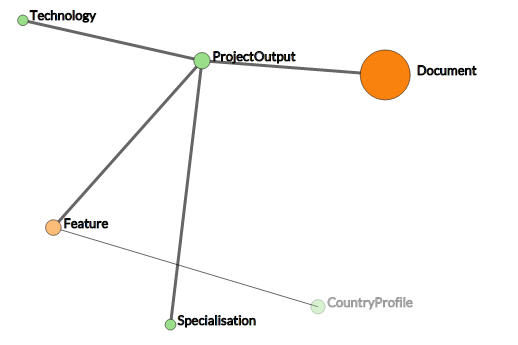
Once a LOD dataset is available, a tool to navigate, explore and query it is necessary. We exploited LODeX,
a tool able to provide a summary of a LOD source starting from scratch, thus supporting users in exploring and understanding the contents of a dataset. Moreover, LODEX provides a visual query
interface to easily compose queries, that are automatically translated in Sparql and executed on a LOD source.
You can try LODeX on our dataset by clicking here.
Conclusion
In this page we have shown the results gained during the "Open linked data Osservatorio Giovani della Regione Emilia-Romagna" project . We consider our work can be helpful for future open government projects aiming to exploit and public open data.Annotation and Mapping Discovery among Data Sources
- Details
- Last Updated on Friday, 20 November 2015 18:31
-
Schema matching is the task of finding the semantic correspondences (mappings) between elements of two schemata

-
Approach: starting from “hidden” meanings associated to schema labels (i.e. class and attribute names, also called terms), the MOMIS Data Integration system discovers lexical relationships among schema elements
- Lexical Annotation of schema labels is the explicit assignment of meanings w.r.t. a reference lexical thesaurus (such as WordNet )
- Manual Annotation is a boring and not scalable task --> Automatic or Semi-automatic Annotation

-
WSD (Word Sense Disambiguation) is the ability of identifying the meanings of words in a context by a computational technique
The semi-automatic CWSD (Combined Word Sense Disambiguation) method:-
associates to each label, one/more WordNet meanings
- combines two WSD algorithms: SD (Structural Disambiguation) exploits the schema derived relationships & WND (WordNet domains Disambiguation) exploits WordNet Domains
-
-
Schema label normalization: is the reduction of each label to some standardized form that can be easily recognized
→ abbreviation expansion and CN (Compound Noun) annotation

- For a detailed description, please see the Phd Thesis of Serena Sorrentino and the Phd Thesis of Laura Po
- Techniques are implemented in NORMS, a tool of the MOMIS-Datariver Data Integrator, developed within the FIT STARTUP project.